
Financial Data Visualization & Dashboards
Real-time financial clarity, designed for decisions.
What it is
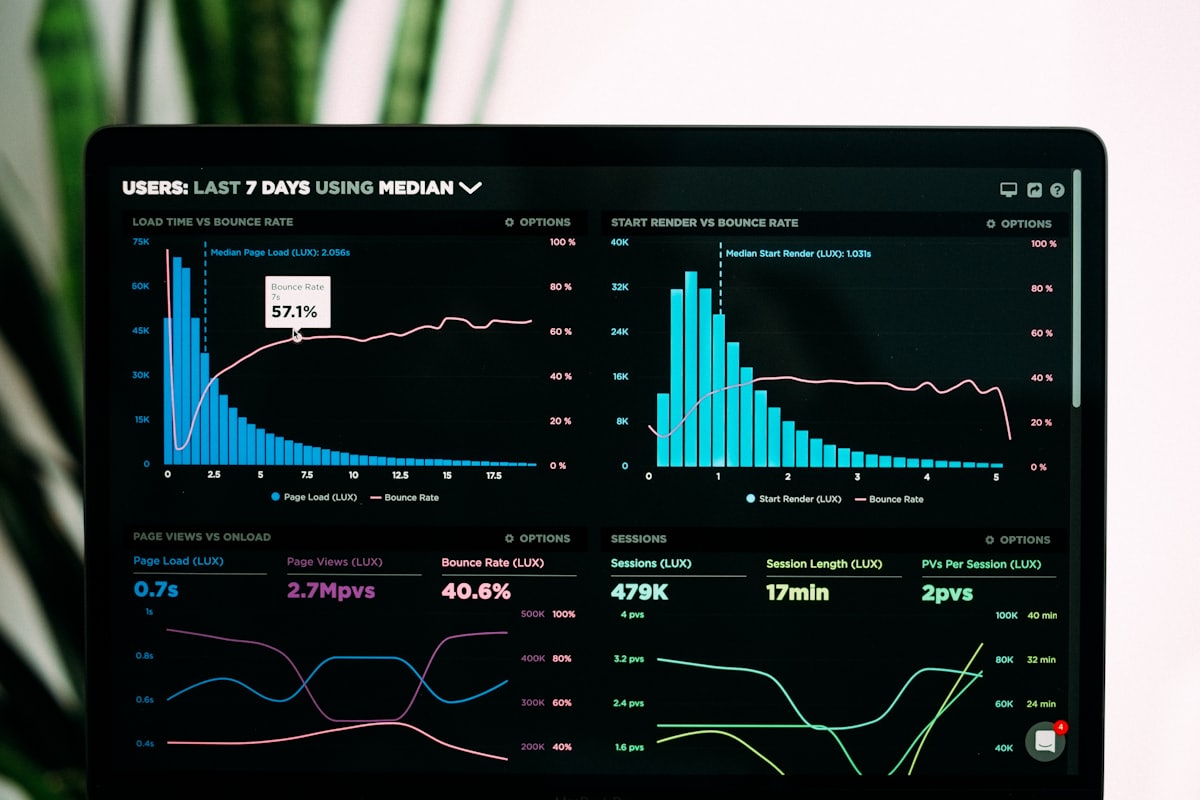
Numbers only create value when leaders can see and act on them. FINFATech designs and builds management dashboards and custom financial reporting systems — in Fathom, Tableau, ClickView, Power BI or bespoke — that track performance in real time and put the right metric in front of the right decision-maker.
- Management dashboards (Fathom / Tableau / ClickView / Power BI)
- Real-time performance tracking tools
- Custom financial reporting systems
- Executive and board reporting design
Why it matters
One source of truth
Consolidated dashboards that replace conflicting spreadsheets and manual reports.
Real-time visibility
Live performance, cash and risk tracking instead of month-old snapshots.
Decision-ready design
Every view is designed around the decisions your leaders actually make.
Self-serve reporting
Custom reporting systems your team can run without rebuilding spreadsheets.
How we deliver it
Discover
We define the decisions, metrics and audiences each dashboard must serve.
Connect
We connect and model your data sources into a reliable reporting layer.
Design
We design clear, decision-first visualizations on your chosen platform.
Operate
We deploy, train your team and maintain the reporting system.
What you receive
- Live management dashboard suite
- Real-time performance and cash tracking views
- Custom financial reporting system
- Executive and board reporting templates
Questions, answered
Explore other services

Profitability & Performance Intelligence
We isolate the customers, products and segments that create value and expose…
Explore service
Forensic Analytics & Financial Integrity
We apply forensic analytics and AI anomaly detection to your transactions to…
Explore service
Cost & Cash Optimization
We analyze your cost structure and working capital to expose hidden costs…
Explore service